The Telemetry Tale: A Journey into the Metrics of Interledger
Written by Sarah JonesCharting the Course
Rafiki is open-source software that enables Account Servicing Entities (ASEs), like digital wallet providers, to leverage Interledger functionality. Interledger creates interoperability between different payment systems and currencies, making payments easier, faster, and cheaper. We hope that by removing the friction of this integration, we can expand the adoption of Interledger and grow the network.
This is where our tale begins, on a balmy August in 2023, with the Rafiki team united for our work week in Cluj-Napoca, Romania.
In order to measure the growth of the network, we needed to capture its state over time:
- how many transactions occurred on the network over the last week / month / year
- how much value flowed over the network in the last week / month / year
Since telemetry was marked as a high-priority item, promises were made about completing the feature in the course of the week. We envisioned a streamlined process using managed services. With a few configuration and integration tweaks, we’d be up and running in no time, right? Not quite, as we soon accepted.
It is a truth universally acknowledged that software development timelines are more aspirational than absolute. Telemetry was merged into main 6 months later. This article provides an account of our journey and an explanation of our final solution.
The initial plan was to use OpenTelemetry collectors alongside AWS-managed Prometheus and Grafana. Our decision was driven by a commitment to flexibility, compatibility, and open standards. OpenTelemetry (Otel) is a standardized observability framework that is designed to provide a uniform way to capture and export telemetry data across various environments. We chose to use Prometheus and Grafana, but with Otel collectors, integrating ASEs could send these metrics to different backends for their own use as well. Prometheus is a monitoring toolkit that stores the incoming metrics in its time-series database. It includes its own query language, PromQL, that enables detailed querying and analysis of the data. Grafana can query Prometheus directly using PromQL, allowing us to create visualizations of the collected metrics in dashboards.
The open-source nature of these components aligns with Rafiki’s principles, ensuring our telemetry stack not only meets our technical requirements but also reflects our commitment to open, accessible technology.
We donned headsets, turned the music up, and set off to work spinning up our required services and diving into the Rafiki code base.
Navigating Cloud Complexities
The allure of managed services began to fade as we grappled with their constraints. Managed services add complexities to troubleshooting, where the confluence of permissions, network access, and external service configurations can interplay in unexpected ways. Debugging became one of our biggest challenges.
Throughout this process, Grafana was our only source of truth, serving as our sole beacon of verification for whether metrics were successfully being captured. Prometheus, acting as a managed-service intermediary, was an inscrutable black box. This was despite having activated every available logging feature within AWS.
This meant that when we encountered issues it was not clear whether the problem lay in a breakdown in communication between Prometheus and Grafana or whether it was between the Otel SDK and Prometheus. To diagnose problems we had to redirect the Otel collector’s Prometheus write URL to a BusyBox setup where we could perform a tcpdump to capture and inspect packets and verify if data was indeed being sent.
We ran into a roadblock when we realized that AWS-managed Grafana does not allow for public dashboards. To resolve this we had to actually abandon AWS-managed Grafana and move over to Grafana Cloud. They offered a workaround by editing the configuration to enable public dashboard access upon request—a process they handled with commendable responsiveness. Unfortunately, it still fell short by imposing limitations on embedding these dashboards on our own site.
Despite Grafana Cloud’s responsive support team, we also encountered issues adding the AWS-Managed Prometheus as a data source. Our sigv4 authentication failed with a 403 Forbidden response, despite having the appropriate IAM permissions. The issue resolved spontaneously without clear intervention, implying an external factor (potentially AWS-side changes or maintenance) was at play.
You can view our public dashboard for test data telemetry on Grafana Cloud.
Here is an example of how it looks:
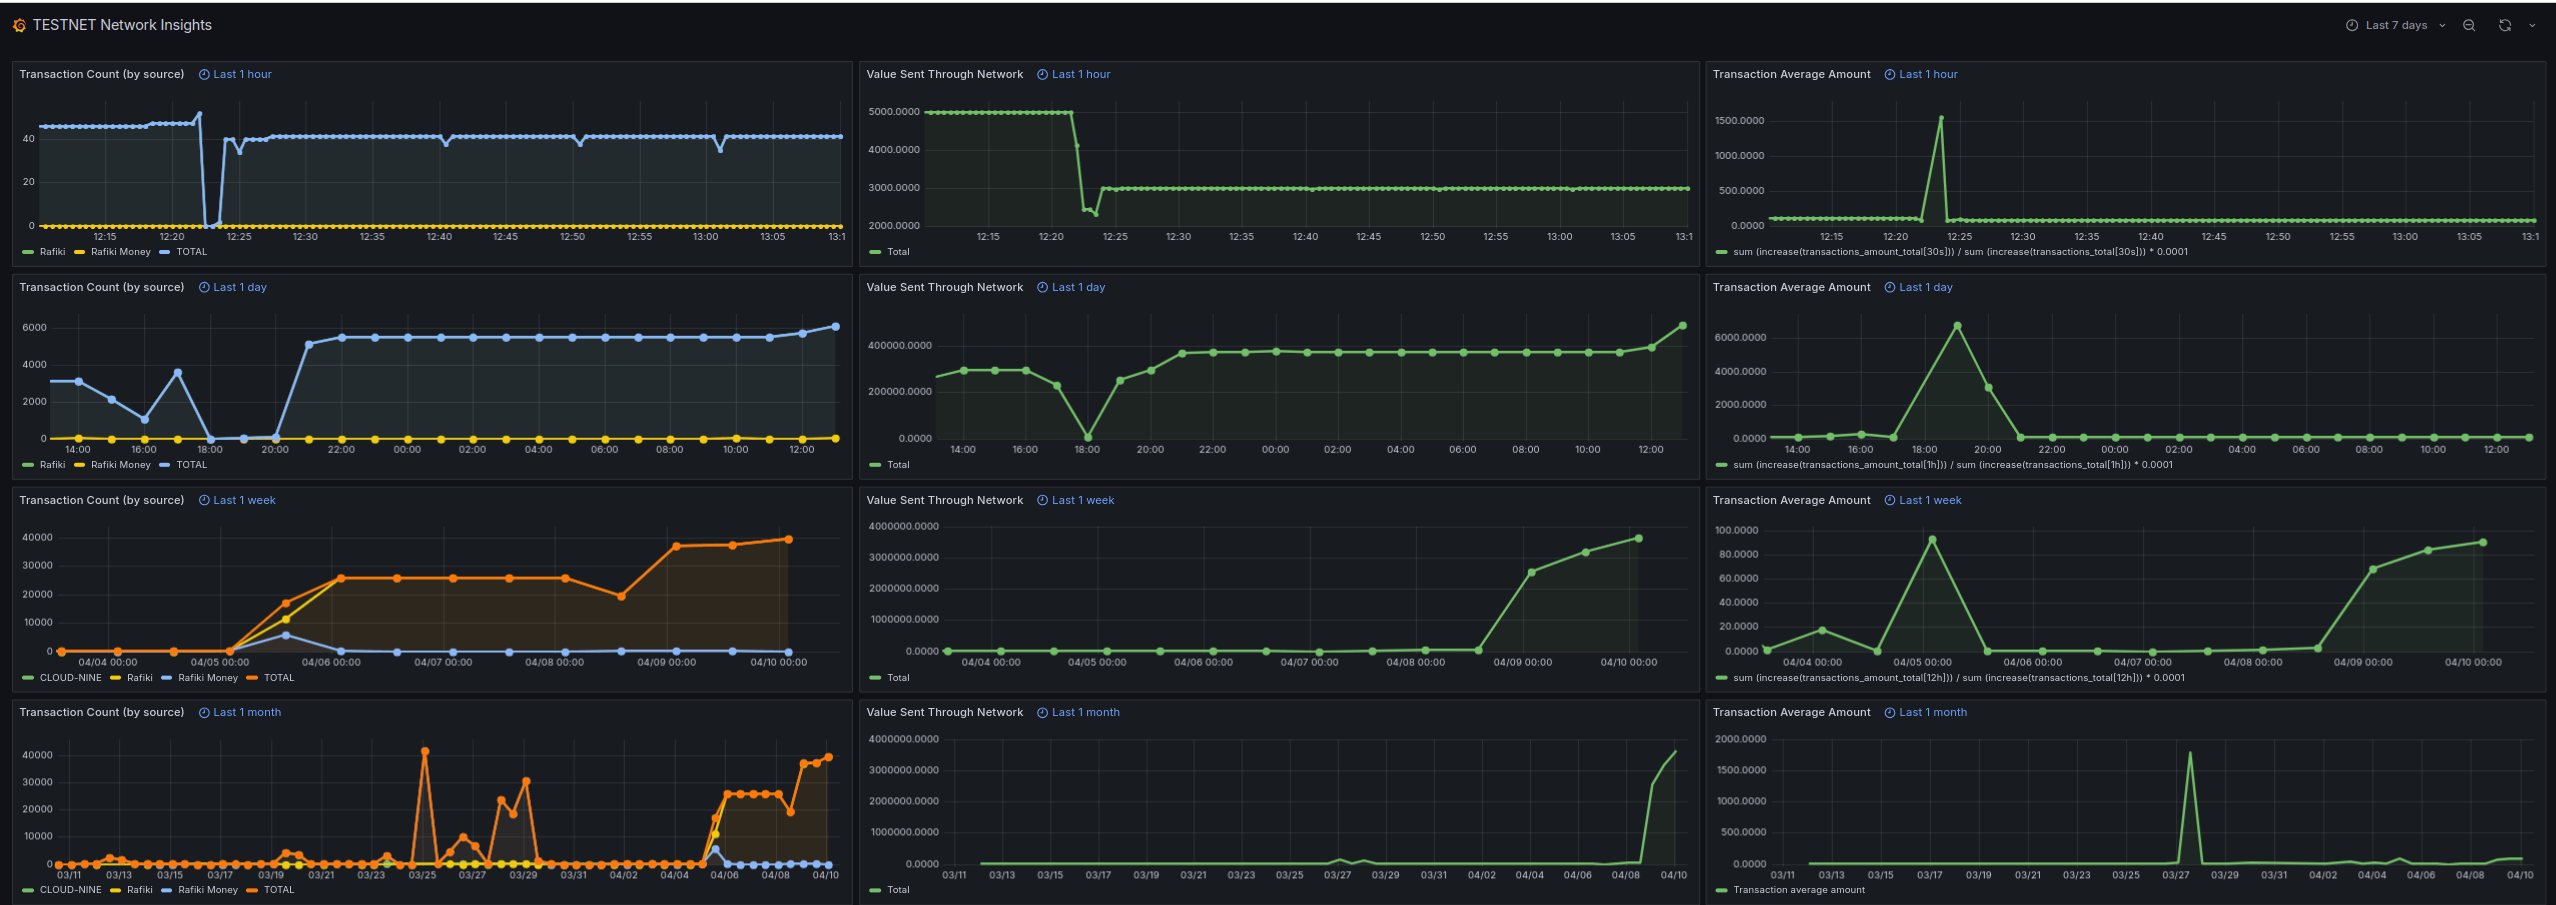
Each column of our dashboard represents one of our metrics (number of transactions, value sent through the network, and average transaction value) measured over the last hour, day, week, and month respectively.
Refining Our Course
As we moved past our infrastructure hurdles, our attention shifted towards decisions surrounding our approach to data collection. Initially, the idea of capturing transaction values in their original currencies seemed appealing. It promised insights into the diversity of currencies traversing the Interledger network and their respective volumes.
Upon deeper reflection, we recognized the potential privacy implications of such granularity. Given the predominance of USD transactions, data on less common currencies could inadvertently reveal specifics about the activities of certain entities.
To mitigate this risk and enhance data anonymity, we opted to standardize on USD as the base currency for all transactions. This decision introduced a new challenge: not all ASEs might have the means to convert their transactions to USD. To address this, we incorporated a local rates conversion service.
Unfortunately, we couldn’t find a free service that provides all the conversions we might want. So we’ve implemented an AWS Lambda function which runs daily, pulling data from our configured sources and then storing it in an Amazon S3 bucket.
This setup positions us to seamlessly integrate additional data sources as needed by adding the new data source to our Lambda function. Currency conversions are processed internally within the Rafiki instance itself, maintaining confidentiality from public exposure.
While we were extracting transaction counts at the level of individual payments, we recognized that tracking transaction values at this level compromised privacy by revealing the full transaction value amount. Finding an optimal location to extract the value metric was not straightforward.
We were initially unsure of collecting our metrics at the ILP packet level since this layer did not readily expose the asset’s scale and currency information that we needed to get all value metrics into a comparable form. So we shifted our focus to the accounting layer. This layer processes the outcomes of packet layer interactions (such as successfully delivered packets and failed or rejected transfers) and converts these activities into financial records.
We considered embedding our telemetry logic directly within this layer, but ultimately decided to maintain a better separation of concerns by building telemetry its own middleware. Using a middleware layer also gave us greater flexibility in exposing the full context we needed which opened up the possibility of using the ILP connector core to extract our value metrics at packet level.
Connectors apply currency exchange as needed and forward ILP packets from the sender to the receiver through the Interledger network. Positioning our data extraction at a packet level ensured that data from a single transaction, potentially spread across multiple packets, or data from various transactions occurring simultaneously, could not be traced back to a specific single payment.
A significant issue emerged when considering scenarios where the maximum packet value could accommodate an entire transaction amount within a single packet. Such a case threatened to undermine our privacy safeguards. This underscored the complexity of our task and highlighted the necessity for formalized, privacy-preserving methodologies in our telemetry framework.
Deep Dive into Privacy
Privacy is always important when it comes to financial transactions. It is not only about individual and institutional confidentiality, but it is also a protective mechanism against market manipulation. Concealing transaction volume and pattern specifics allows us to prevent market participants from using the information to influence prices or liquidity. With this in mind, we re-worked our strategy using a layered, privacy-centric approach. We also ensure all data anonymization occurs locally.
Packetization
The Interledger Protocol (ILP) naturally anonymizes transactions by splitting larger transactions across multiple payment packets. This only applies when the maximum value per ILP packet is smaller than the total transaction value.
Currency Conversion
Converting all transactions to a standardized base currency ensures a uniform metric for comparison and introduces a degree of data obfuscation through the daily sampling of conversion rates, which adds an approximation layer to the transaction details. Our AWS Lambda function retrieves and stores daily exchange rates in a publicly accessible Amazon S3 bucket, deliberately avoiding versioning to further enhance privacy. Of course, this is only relevant for non-USD transactions.
Bucketing and Rounding Technique
This method categorizes transaction values into “buckets” to protect privacy, with the bucket size dictating the rounding precision. For common, lower-value transactions, we use a linear scale to create closely spaced buckets, enabling detailed granularity. For less common, higher-value transactions that necessitate greater privacy, we switch to logarithmic scaling, resulting in wider bucket intervals.
Extreme values are managed by “clipping,” where values beyond set thresholds are grouped into maximum or minimum buckets, ensuring all values fall within predefined limits. Values are then rounded to a precision point that is determined by the nearest bucket edge.
| Raw Value | Bucket Size | Rounded Value |
|---|---|---|
| 8,300 | 10,000 | 10,000 |
| 13,200 | 15,000 | 15,000 |
| 147,700 | 160,000 | 160,000 |
| 1,426,100 | 2,560,000 | 2,560,000 |
| 1,788,200 | 2,560,000 | 2,560,000 |
| 90,422,400 | 10,000,000 | 90,000,000 |
| 112,400,400 | 10,000,000 | 100,000,000 |
| 222,290,500 | 10,000,000 | 100,000,000 |
Local Differential Privacy
Fully activating nerd mode, we read up on Local Differential Privacy (LDP). LDP is a variant of differential privacy where noise is added to each individual’s data point locally before it is made available for collection. Once the data has been rounded, we apply a random amount of noise to each data point.
This noise is derived from the Laplacian distribution which is generated based on a privacy parameter that is relative to the size of the rounded value. This distribution is characterized by its sharp peak and exponential decay, which means that most of the noise added to the data will be relatively small, thus minimally impacting the overall utility of the data, while providing a strong guarantee of privacy.
Central to our privacy framework is empowering ASEs with the informed ability to opt-in or opt-out of the telemetry service. We also only collect data on outgoing payments, thus honoring the preferences of those who may choose to disable telemetry. In other words if one ASE enables telemetry and receives payments from an entity who has not enabled telemetry we won’t collect metrics on those incoming payments.
For more information please have a look at our privacy docs and our implementation.
Architecture and Instrumentation
The number of transactions is extracted from the Open Payments outgoing payment lifecycle and the value metric is handled by a telemetry middleware layer inside the ILP connector core.
In summary, before these metrics are sent to the Otel collectors, we’ve implemented local privacy-preserving measures, including:
- packetization which is inherent in the Interledger Protocol (ILP)
- a currency conversion service that uses a custom AWS Lambda function that pulls daily exchange rates from configured sources and stores them in an Amazon S3 bucket
- rounding data to a precision point determined by bucketing
- local differential privacy in the form of adding Laplacian noise to anonymize transaction data
Finally, we grappled with the dilemma of disentangling playground data from our test network and live production data. The Test Network (Testnet) is an open Interledger network using test money within example wallet and e-commerce applications. Rafiki also provides a local playground to experiment with. We’d like to monitor activity within the testing environments to gauge interest in the Interledger Protocol (ILP) and identify usage patterns by new participants.
We’ve opted to provide users the choice between the test network (testnet) and the live network (livenet). To support this dual-environment approach, the infrastructure for telemetry was effectively expanded to include two separate services: one dedicated to collecting and managing telemetry data from the test network and another for the live network. This setup ensures that data from each environment is handled independently.
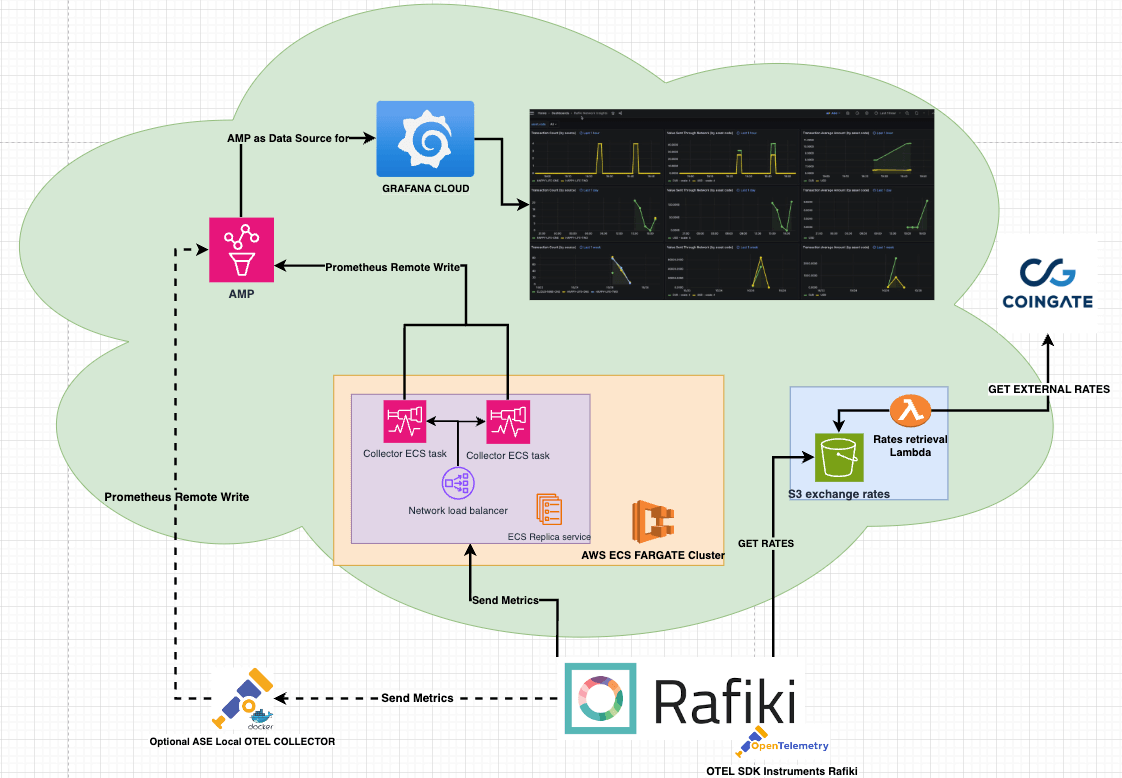
Our telemetry clusters are deployed on AWS, utilizing the ECS Fargate service to support two distinct operational environments: the live network environment (livenet) and the test network environment (testnet). Since the two environments are separate, it is the Rafiki client that determines where to send the data and the load balancers themselves do not need to decrypt GRPC/HTTPS messages to direct traffic between environments. This way each environment has its own load balancer to simply load-balance over their set of ECS task replicas. This configuration maintains good separation between testnet and livenet data as well as optimizing our resource utilization, leading to a cleaner, more efficient, and cost-effective telemetry infrastructure.
When integrating ASEs opt-in for telemetry, metrics are sent to our Telemetry Services using gRPC. The collectors capture and export our data by periodically pushing it to an Amazon-managed Prometheus (AMP) instance for storage. Finally, Grafana Cloud is used to query Prometheus in order to visualize our data in dashboards.
In order for ASEs to build their own telemetry solution, Rafiki can send data to multiple endpoints. This allows for integrating a local Otel collector container that acts as a sidecar and can support custom requirements.
Thus ASEs can choose to opt-in and send telemetry metrics to us, optionally collect metrics for their own personal use, or opt-out of telemetry entirely.
Please check out our telemetry docs, integration guide, and our telemetry code on GitHub.
Reflecting on Our Journey
A lot of what we’ve covered in this article could be construed as scope creep. What initially seemed like a straightforward goal evolved into a more complex and considered endeavor. I like to think that this is not a bad thing, though. We are a team who have a proactive approach to understanding and resolving challenges. This journey is a testament to the iterative nature and necessary time that this process requires.
That said, we could have benefited from more time upfront for understanding and planning instead of simply diving straight in. Perhaps, our work week eagerness may have led us to jump in too quickly. It is with a great sense of accomplishment that we now have telemetry running in our development environment where we are seeing how it holds up against our test data and hope it will be used in a production environment shortly.
We look forward to having a real handle on the pulse of the ILP network soon. Of course, this journey is far from its conclusion. Telemetry, by its nature, is an ever-evolving domain, requiring adaptation to meet the network’s growing needs and challenges. Having laid a solid foundation, future developments should be smoother.
As we reflect on our path thus far, the question is: “Given our current knowledge and experiences, would we approach this project differently?” In hindsight, we would have used self-hosted Prometheus and Grafana instances from the start and avoided many of the problems we faced. This is a goal which remains on our roadmap, in order to provide us with the flexibility we seek. Some of the back and forth on our decision-making would have been smoother had we spent some more time in discussions at the start about what privacy factors to keep in mind and how public our results were intended to be.
As we are open source, you can easily check our work on GitHub. If the work mentioned here inspired you, we welcome your contributions. You can join our community Slack or participate in the next community call, which takes place each second Wednesday of the month.
If you want to stay updated with all open opportunities and news from the Interledger Foundation, you can subscribe to our newsletter.